
AI Support Resolution Rates: Why the 2026 Benchmarks Do Not Compare
An AI support resolution rate is the share of customer conversations an AI agent ends without a human. Every major vendor and buyer now publishes one, and almost none of them are computed the same way. The denominators differ, the exclusions differ, and in at least one widely quoted case there is no denominator at all. That makes the published 2026 benchmarks unusable for comparison, which is a problem when support leaders are signing contracts against them.
Related product hub: AI ticket automation for automation that prefers resolution over deflection vanity.
This benchmarks post supports AI ticket automation. Prefer resolution framing over deflection vanity, and never invent a 60% auto-resolve hero.
This is not a call for a new standard. It is a method for normalizing the numbers you already have. IrisAgent publishes validated accuracy above 95% through its Hallucination Removal Engine, and the reason that figure is stated with a validation method attached is the same reason this guide exists: a rate without its method is a marketing asset, not a measurement.
The measurement failure has now been quantified three times
For two years the gap between AI support claims and AI support results was an anecdote. In August 2026 it became a set of numbers, from three independent research efforts inside three weeks.
Gartner scored 432 customer service AI use cases. Only 25% produced positive ROI. 25% delivered negative returns, 11% broke even, and 42% were unclear, meaning the leaders running them could not determine whether they had created value. Teams are running nearly five use cases each and committing roughly 13% of functional budget to AI, and more than 75% still plan to increase 2026 investment. Info-Tech's Julie Geller put the cause plainly: too many rollouts begin with pressure to show the board a credible AI strategy rather than with a defined business problem.
Forethought, now part of Zendesk, surveyed more than 600 CX leaders and found 70% have adopted AI in CX, up from 57% in 2025, while only 2% see actual value and ROI. 75% of enterprises rolled back customer-facing AI agents after deployment. That is the sharpest churn number of the year and it comes from a competitor's own research.
Talkdesk, through NewtonX, surveyed 252 director-level and above CX, IT, operations and AI-strategy leaders. 98% have deployed AI somewhere in the customer journey. Only 5% can quantify AI's impact on business outcomes. 85% cannot orchestrate an end-to-end resolution, 94% operate without AI-assisted knowledge management, and only 35% retain customer context across systems.
Read together, those three say something specific. The problem is not that AI support does not work. It is that the industry cannot tell you when it worked, because nobody agrees on what counts.
Seven published numbers, seven different questions
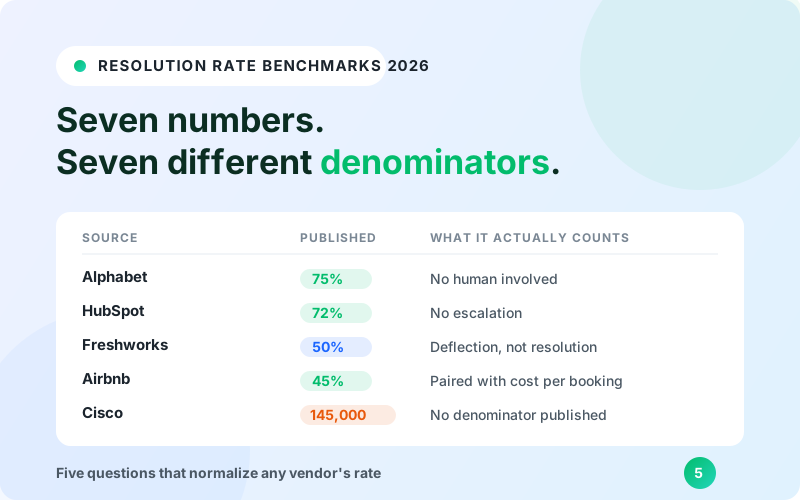
Here is what the category actually put on the record in 2026. Each of these is real, sourced, and stated by the organization itself. None of them answer the same question.
Organization | Published figure | What it actually measures |
|---|---|---|
Alphabet (Google Ads support) | 75% autonomously resolved | Share of support queries resolved with no human, stated on the Q2 2026 earnings call by SVP Philipp Schindler |
OpenAI (Presence) | 75% | Self-reported, method not published |
HubSpot (Customer Agent) | 72% of tickets | Resolved without human escalation. Escalation is the exclusion, not customer outcome |
Freshworks | 50% average deflection | Deflection, not resolution. A different formula entirely |
Airbnb | ~45% of inquiries | No human involved, up from 40% in Q1 2026, alongside support cost per booking down roughly 16% year over year |
Sierra | 85% IVR task success | Task success on phone-tree navigation, up 49 points from 57%. Task-level, not conversation-level |
Cisco | 145,000 cases | An absolute count for FY2026 with zero human intervention, stated on the Q4 FY2026 call by CEO Chuck Robbins. No denominator published |
Line them up and the incomparability is obvious. Alphabet and HubSpot both report roughly three quarters, but HubSpot's exclusion is escalation while Alphabet's is human involvement of any kind. Freshworks reports deflection, which counts tickets that were never created, a fundamentally different event from a conversation that ended well. Sierra's 85% is task success inside a phone tree, an impressive engineering result that is not a support resolution rate at all. And Cisco's 145,000 is the clearest case: it is a large, real, verifiable number that cannot be compared to anything, because 145,000 out of an unstated total could be 90% of the queue or 9% of it.
Airbnb's disclosure is the most useful of the seven, for one reason. It pairs the rate with an independent business metric, support cost per booking, moving in the same direction. A rate that moves alone is a claim. A rate that moves alongside cost or CSAT is evidence.
Keep the three formulas apart
Most of the confusion above collapses once you stop treating three different metrics as synonyms.
Deflection asks whether a ticket was ever created. It is measured against contact volume that did not happen, which makes it the easiest of the three to inflate and the hardest to audit. Our guide to ticket deflection covers the formula, and the AI deflection rate breakdown covers what changes when the deflecting system is an AI agent rather than a help center article.
Containment asks whether the conversation stayed inside the bot. It says nothing about whether the customer got what they came for. A customer who gives up is contained. See chat containment rate for how to read it without fooling yourself.
Resolution asks whether the customer's problem actually ended. It is the only one of the three that is about the customer rather than about the queue.
These can move in opposite directions, which is the entire trap. An AI agent that asks two clarifying questions and then gives up scores well on deflection and containment and badly on resolution. An AI agent that confidently states the wrong refund policy resolves the chat today and creates a larger ticket, and possibly a chargeback, next week. If a vendor reports one number and calls it all three, that is the finding.
We published the full three-condition test in what counts as a resolution in AI support. The short version: a conversation is resolved when the answer was grounded in your knowledge, no human had to take over, and the customer was not signalling a failed attempt, an error, a stall, or existing anger. If any one of those fails, it is not a resolution.
How to normalize any vendor's number
You will not get vendors to adopt a common standard. You do not need them to. Five questions convert almost any published rate into something you can compare, and they work on a slide in a live demo.
What is the denominator? Of what population is this a percentage: all inbound contacts, only conversations the AI was allowed to touch, or only conversations it chose to answer? A 70% resolution rate on 20% coverage is a pilot. A 40% rate on 90% coverage is a production system. Ask for both numbers or the rate means nothing.
What is excluded, and is the exclusion list written down? Handoffs, clarifying questions, errors, internal dashboard previews and abandoned sessions all have to land somewhere. A vendor who cannot itemize what does not count is reporting activity.
Does a clarifying question count as an answer? This single choice can move a reported rate by double digits. It is the most common quiet inflation in the category.
Over what window, and against what baseline? A rate measured in the first eight weeks after launch, when the AI is deployed on the easiest intents, is not the steady-state rate. Ask what it was at month six.
What independent metric moved with it? Cost per contact, CSAT, repeat contact rate, escalation rate. If the resolution rate rose and none of those moved, the definition changed, not the performance.
Run those five against the table above and the seven numbers sort themselves quickly. Airbnb answers question five. Cisco cannot answer question one. Most vendor decks stop at question two.
The audit standard your own numbers will face
The trade press has started doing forensic accounting on vendor metrics. In August 2026 CX Today lined up IntouchCX's published case studies for the same product and found the January retailer study did not reconcile with the May summary, and that the company's own awards submission reported a third, different set of figures. It also noted that adoption in the pilot went from 9% to 18%, meaning 82% of eligible agents never used the product, which is a self-selection problem large enough to explain the result on its own.
The checklist applied there is now the working standard, and it is worth applying to yourself before you publish anything:
Cohort size, stated, not implied
The baseline, and how it was established
Control timing, so a seasonal dip is not read as a product effect
Statistical testing, or an explicit admission that none was done
Full cost, including the scenario writing, calibration and review labor that never appears in the licence fee
What to ask on your next vendor call
Bring three questions and the conversation changes shape.
Ask for the resolution rate and the coverage rate in the same sentence. Ask for the exclusion list in writing, and check it against your own definition of a resolved ticket before you sign anything that bills per resolution. And ask which independent metric moved with the rate, then ask to see that chart over the same window.
If pricing is tied to resolutions, the exclusion list is not a technical detail. It is the commercial core of the contract. IrisAgent offers usage-based and resolution-based plans, and on the resolution-based plans the exclusion list is published for exactly this reason: a per-resolution price is only meaningful if both parties can rebuild the number from the same four-way split of grounded resolves, handoffs, stalls and red-flag conversations. You can model either shape against your own volume in the ROI calculator, and Managed Resolution documents how the outcome-based version is measured.
The category will get a shared standard eventually. Until it does, the buyers who do best are not the ones who found the vendor with the highest published rate. They are the ones who asked what the rate was a percentage of.
See latest stats: Customer support statistics 2026.
Frequently Asked Questions
Why do published AI support resolution rates not compare?
Because each is computed on a different denominator. Alphabet reported 75% of Google Ads support queries resolved with no human on its Q2 2026 earnings call, HubSpot reported 72% of tickets resolved without human escalation, Freshworks reported 50% average deflection, and Cisco reported 145,000 cases resolved with zero human intervention in FY2026 with no denominator at all. Those measure four different events. A rate is only comparable if you also know what population it is a percentage of.
What is the difference between deflection, containment, and resolution?
Deflection asks whether a ticket was ever created. Containment asks whether the conversation stayed inside the bot. Resolution asks whether the customer's problem actually ended. They can move in opposite directions. An AI agent that asks two clarifying questions and gives up scores well on deflection and containment and badly on resolution. Only resolution is about the customer rather than the queue.
How do I normalize a vendor's published resolution rate?
Ask five questions. What is the denominator, all inbound contacts or only conversations the AI was allowed to touch? What is excluded, and is the exclusion list written down? Does a clarifying question count as an answer? Over what window and against what baseline? And which independent metric, such as cost per contact or CSAT, moved with it? If the rate rose and no independent metric moved, the definition changed, not the performance.
What does the 2026 research say about AI support ROI?
Three independent studies published within three weeks in August 2026 quantified the gap. Gartner scored 432 customer service AI use cases and found only 25% produced positive ROI, 25% delivered negative returns, and 42% were unclear because leaders could not determine value. Forethought surveyed 600+ CX leaders and found 70% adoption but only 2% seeing actual value, with 75% of enterprises rolling back customer-facing agents. Talkdesk surveyed 252 director-level leaders and found only 5% can quantify AI's impact on business outcomes.
Why does coverage matter more than the resolution rate itself?
A high rate on a narrow slice is a pilot, not a production system. A 70 percent resolution rate on 20 percent coverage resolves fewer conversations in absolute terms than a 40 percent rate on 90 percent coverage. Any vendor reporting a resolution rate without the matching coverage rate has given you half the fraction. Ask for both in the same sentence.

Loading the form. Prefer email? Reach us at info@irisagent.com or call +1 617 249 3312.