
AI Observability for Customer Support Agents: What to Monitor in Production
AI observability is the practice of recording what an AI system did on every request, including the input, the sources it retrieved, the model and prompt it used, the actions it took, and the answer it returned, so a team can explain any output and catch failures in production. For a customer support AI agent, that record is the difference between "the bot got it wrong" and "the bot got it wrong because Tuesday's KB edit removed the refund article."
IrisAgent customers hold validated accuracy above 95% in production. Testing before launch gets an agent there. Observability is what keeps it there after the knowledge base, the model, and the questions start changing.
This guide covers what a support AI trace should capture, the five signals worth monitoring, the alerts that deserve a page, and where generic LLM observability tools fit next to support-native monitoring.
Observability vs. Testing vs. Analytics
These three practices get blurred together, but each answers a different question at a different time.
Practice | Question it answers | When it runs | Typical owner |
|---|---|---|---|
Testing | Is this version safe to ship? | Before launch and after each change | Support ops with AI or platform engineering |
Observability | Why did the agent do that, on this conversation, right now? | Continuously, on every live request | Platform or AI engineering |
Analytics | Is the AI improving outcomes for customers and the business? | Weekly and monthly trends | Support leadership |
Testing is covered in depth in our guide on how to test an AI customer service agent, including when to re-run the suite. Outcome reporting (resolution, deflection, CSAT, knowledge gaps) is the job of conversational AI analytics. Observability sits between them. In practice, it is the layer that turns a bad analytics trend into a specific, fixable cause.
What a Support AI Trace Should Capture
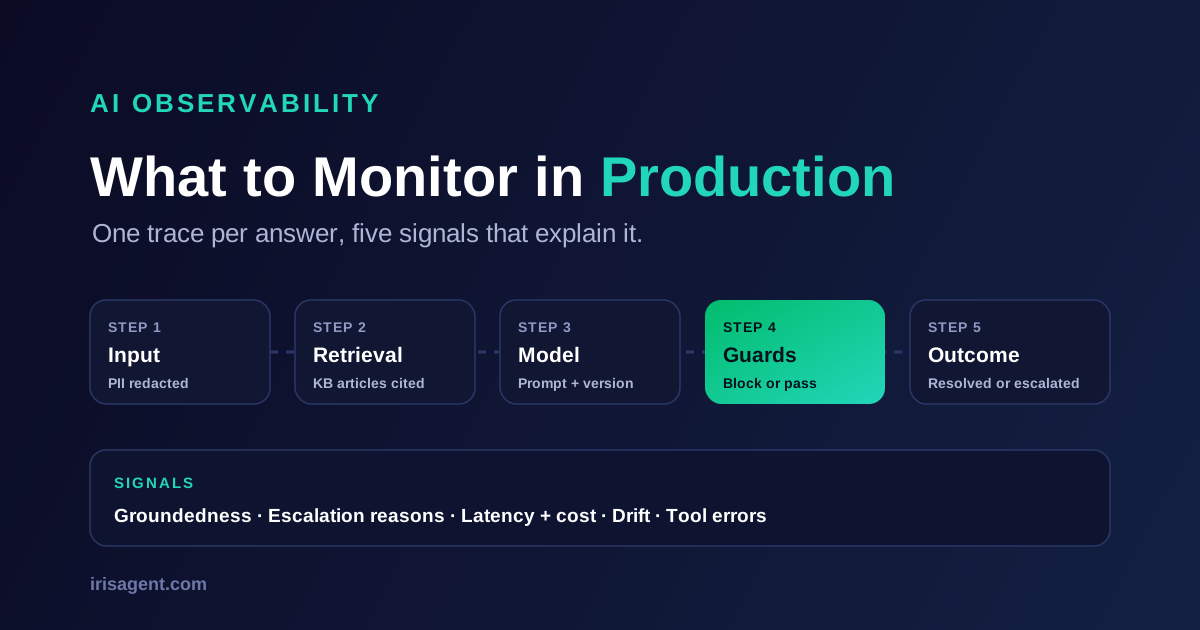
A trace is the full record of one request as it moves through the agent. If any step is missing, you cannot explain the answer. A complete trace for a support AI agent captures seven things:
The customer input, with PII and secrets redacted before anything is stored.
The retrieval set: which knowledge base articles and past tickets were pulled, their relevance scores, and which product or customer segment the search was limited to.
The prompt version and model: the exact instruction template, the model name and version, and the provider that served the call.
Tool calls: every lookup or action the agent invoked (order status, refund, account change), with arguments and responses.
Guard verdicts: whether output checks passed, blocked, or rewrote the answer, and why.
The final answer and its citations, as the customer saw it.
The outcome: resolved, escalated (with the reason), or abandoned, plus any later customer reply or agent edit.
Two details matter more than they look. First, redaction must happen before logging, not after. Otherwise the observability store becomes the place where card numbers and API keys pile up. Second, every trace needs the prompt and knowledge base version attached. Without versions, you can see that answers changed but not what changed them.
The 5 Signals to Monitor in Production
Most LLM observability dashboards default to tokens, latency, and error counts. Those matter, but they will not tell you a support agent is quietly giving wrong refund answers. These five signals do.
1. Groundedness and guard activity
Track the share of answers that cite a source, and the rate at which output guards block or rewrite an answer. A sudden jump in guard blocks is often the first sign that retrieval broke, because the model starts answering from memory and the guard catches it. The accuracy and hallucination thresholds to hold before go-live are in our guide to reducing AI hallucinations in customer support. Observability is how you notice when production drifts below them.
2. Escalation reasons, not just escalation rate
An escalation rate of 30% tells you little. However, escalations classified by reason tell you exactly where to work: "no relevant article found," "customer asked for a human," "action not permitted," "low confidence," "tool call failed." The first reason points to a knowledge gap. The last one points to an integration that needs fixing. Each reason has a different owner.
3. Latency and cost per resolved conversation
Watch p50 and p95 latency per step, not just end to end, so a slow retrieval call does not hide behind a fast model. For cost, divide total model and tool spend by resolved conversations, not by requests. Cost per request can fall while cost per resolution rises, for example when a cheaper model resolves fewer tickets on the first try.
4. Drift after changes
Answers change when anything underneath them changes: a model upgrade, a prompt edit, a knowledge base update, a provider failover. Tag every trace with those versions, then compare the signals above before and after each change. The question is simple: did this version resolve more and fabricate less than the last one, on the same kinds of questions?
5. Tool-call and action errors
Once an agent can take actions, a failed tool call is a customer-facing failure. Monitor tool error rates, timeouts, and actions attempted outside policy (a refund above the limit, an account change without verification). Also log every model or provider failover. A failover that keeps the agent up is a success, but a steady stream of them is a vendor problem worth knowing about.
Alerts Worth Paging Someone For
Dashboards get read on Mondays. Alerts decide what gets fixed today. Start with a short list and tune thresholds to your own baseline after two to four weeks of data.
Signal | Example alert rule | First response |
|---|---|---|
Guard block rate | Doubles versus the trailing 7-day average within an hour | Check retrieval health and recent KB edits |
Citation coverage | Falls below 90% of auto-sent answers | Check the retrieval index and segment filters |
Escalation reason "no article found" | Spikes on one intent | Look for a new product issue or a deleted article |
p95 latency | Exceeds your channel budget (for example, 8 seconds on chat) for 15 minutes | Check provider status and failover logs |
Tool-call errors | Above 2% on any action for 15 minutes | Disable the action, route to humans, page the integration owner |
Cost per resolution | Rises 25% week over week | Compare model mix and resolution rate by version |
These numbers are starting points, not benchmarks. A billing-heavy queue and a password-reset queue will settle at very different baselines.
Generic LLM Observability Tools vs. Support-Native Monitoring
General-purpose LLM observability tools are good, and for some teams they are the right answer. Langfuse, Arize Phoenix, LangSmith, and Datadog LLM Observability all capture traces and spans, token usage, latency, and cost. Langfuse and Phoenix can be self-hosted. Datadog puts LLM traces next to the rest of your infrastructure monitoring, which helps when the root cause is a database rather than a model. If you are building your own support agent on raw model APIs, start with one of these.
The limit is that they do not know what a correct support answer looks like. They can show that the agent cited an article. They cannot tell you the article is last year's return policy, that the escalation was unnecessary, or that the refund broke your policy. You have to build that layer yourself: evals tied to your knowledge base, a rubric for support quality, and labels for escalation reasons.
Support-native monitoring starts from that layer. It scores answers against your own knowledge base and policies, classifies escalations by reason, and ties every signal back to tickets your support team already understands. The tradeoff is depth on infrastructure: a support platform will not replace your APM. Many teams run both, with the support platform owning answer quality and the general tool owning the infrastructure under it.
How IrisAgent Handles Observability
IrisAgent builds observability into the path every model call already takes. Iris Control, the LLM control plane behind IrisAgent, logs prompts and completions for every call in one place. It also redacts PII and secrets before the provider call and before the record is stored. The same layer handles model routing and failover, keeps retrieval inside the product or segment a request may search, and runs output guards so hallucinated answers are blocked before they reach a customer.
On the quality side, AutoEval turns production signals (customer votes, agent edits, and escalations) into a golden eval set, so every new model is scored on your data before it reaches production. The Support Model Arena publishes how models compare on answer accuracy and hallucination resistance, with latency and price shown next to quality. For conversation-level review, AutoQA scores 100% of AI and human conversations against your own rules instead of a 5% sample.
That said, the five signals above apply to any vendor. When you evaluate an AI support platform, ask three questions. Can we see the full trace for any answer? Are prompt, model, and KB versions attached to each trace? And can we export traces to our own observability stack?
Key Takeaways
AI observability explains why an agent answered the way it did. Testing checks a version before it ships, and analytics reports outcomes over time.
Capture a full trace per request: redacted input, retrieval set, prompt and model versions, tool calls, guard verdicts, final answer, and outcome.
Monitor five signals: groundedness and guard activity, escalation reasons, latency and cost per resolution, drift after changes, and tool-call errors.
Generic LLM observability tools excel at traces and infrastructure. Support-native monitoring adds the answer-quality layer they leave to you.
Start this week: pull 50 recent escalations and label each one with a reason. That one list shows whether your current monitoring can explain them, and what your traces are missing.
Frequently Asked Questions
What is AI observability?
AI observability is the practice of recording what an AI system did on every request, including the input, retrieved sources, model and prompt version, tool calls, and final output, so teams can explain any answer and catch failures in production. For support AI agents, it connects a wrong answer to its specific cause, such as a deleted article or a model change.
How is AI observability different from LLM monitoring?
LLM monitoring usually tracks aggregate metrics such as latency, token cost, and error rates. AI observability goes further by keeping a full trace of each request, so you can see why a specific answer was produced. Monitoring tells you something broke. Observability tells you what broke and where.
What should you monitor in a customer support AI agent?
Start with five signals: groundedness and output-guard activity, escalations classified by reason, latency and cost per resolved conversation, drift after model, prompt, or knowledge base changes, and tool-call or action errors. Attach prompt, model, and knowledge base versions to every trace so you can compare before and after each change.
Do I need a separate LLM observability tool if my AI support vendor has dashboards?
It depends on what you run. If you build your own agent on raw model APIs, a general tool such as Langfuse, Arize Phoenix, LangSmith, or Datadog LLM Observability is a strong start. If you use a support platform, check that it exposes full per-answer traces with versions and lets you export them. Many teams use both: the support platform for answer quality and a general tool for infrastructure.
How does IrisAgent provide observability for its AI agents?
Iris Control, IrisAgent's LLM control plane, logs prompts and completions for every model call, redacts PII and secrets before storage, handles routing and failover, and runs output guards before answers reach customers. AutoEval scores models on a golden set built from your production feedback, and AutoQA reviews 100% of AI and human conversations against your rules.
Loading the form. Prefer email? Reach us at info@irisagent.com or call +1 617 249 3312.